
U.S. GDP grew at an annualized pace of just 2% last quarter, a marked slowdown from last quarter’s 6.7% (Figure 1). Contracted auto production sliced around 2% off growth, and concerns over the Delta variant slowed demand and the return of workers to the labor force. Third quarter growth disappointed many. Final estimates were for 2.8%, and those had been much higher earlier in the quarter.
Key Points for the Week
- U.S. annualized GDP growth slowed to 2% from 6.7% last quarter as concerns over the Delta variant and ongoing supply issues limited economic growth.
- Businesses seeking to restructure supply chains and altered demand patterns have pushed business investment 13.2% higher during the last 12 months.
- Core PCE inflation increased 0.2% in September, the lowest level in seven months.
Businesses have multiple options when facing a supply shortage. One is to automate more tasks, and business investment increased 13.2% during the last 12 months. Another option is to increase prices. Core PCE inflation indicates prices are rising at a slower pace. The 0.2% increase in inflation for goods excluding food and energy was the smallest in the last seven months and indicates businesses are being cautious when raising prices. When the chief shortage is labor, wage increases can help lure people back to the labor force. Employment costs jumped 1.5% in September.
Investors looked past some of the weakness in the report and focused on the positive. The S&P 500 added on 1.3% and finished 7.0% higher in October. The index of 500 large U.S. stocks ended the month at a new record. The global MSCI ACWI tacked on 0.4%. The Bloomberg U.S. Aggregate Bond Index increased 0.5% last week but finished the month basically unchanged. The U.S. employment report and another round of corporate earnings are the top two data points this week.
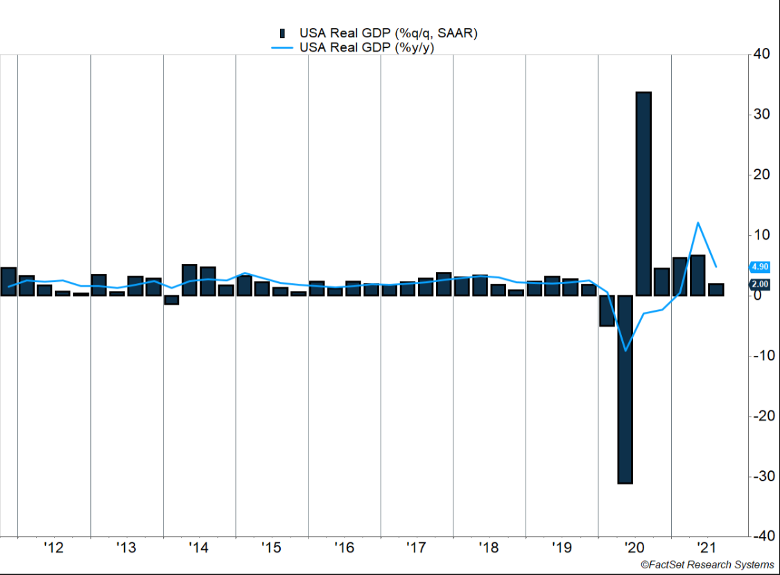
Figure 1
Misfiring
The U.S. economy can no longer be characterized as hitting on all cylinders. This is especially true since the lack of new car production was a major reason economic growth increased much less than expected.
Growth increased just 2%, using annualized calculations (Figure 1), missing final estimates for 2.8%. Supply chain woes showed up throughout the report but most strongly in automobile manufacturing and sales. Automobile sales sliced 2.4% off overall growth as motor vehicle and parts sales plunged 17.6% last quarter.
To pin the blame on new car sales and broader supply challenges alone would be unfair. Initial estimates were for high single-digit growth in the third quarter, and those estimates were reduced consistently. The Delta variant contributed to slowing economic activity by making it riskier for consumers to engage. It also affected whether workers would return to the labor force. Restaurants and other service organizations are having a hard time finding workers, and the labor shortage may have contributed more to the slowdown than sluggish demand. Restaurant purchases grew at less than 25% of last quarter’s rate, indicating reopening didn’t occur fast enough keep the economy in high gear.
Growth is expected to bounce back sharply in the fourth quarter. Economists anticipate some improvement in supply chain challenges. COVID-19 cases are declining, and several countries are reaching major vaccination milestones, which should increase production and alleviate some product shortages. Inventories have also been tapped for supply in recent quarters, and manufacturers will increase production for immediate sale and to provide adequate inventory for future demand.
There are risks to expecting a big bounce back next quarter. Challenges in the supply chain are proving persistent, as companies struggle to adjust to higher demand. Labor supply isn’t bouncing back as quickly as many hoped. Many workers have left the labor force, and service businesses can’t recover as quickly without them. The U.S. employment report will provide the next major set of clues to determine if this economy can recover its strength.
–
This newsletter was written and produced by CWM, LLC. Content in this material is for general information only and not intended to provide specific advice or recommendations for any individual. All performance referenced is historical and is no guarantee of future results. All indices are unmanaged and may not be invested into directly. The views stated in this letter are not necessarily the opinion of any other named entity and should not be construed directly or indirectly as an offer to buy or sell any securities mentioned herein. Due to volatility within the markets mentioned, opinions are subject to change without notice. Information is based on sources believed to be reliable; however, their accuracy or completeness cannot be guaranteed. Past performance does not guarantee future results.
S&P 500 INDEX
The Standard & Poor’s 500 Index is a capitalization-weighted index of 500 stocks designed to measure performance of the broad domestic economy through changes in the aggregate market value of 500 stocks representing all major industries.
MSCI ACWI INDEX
The MSCI ACWI captures large- and mid-cap representation across 23 developed markets (DM) and 23 emerging markets (EM) countries*. With 2,480 constituents, the index covers approximately 85% of the global investable equity opportunity set.
Bloomberg U.S. Aggregate Bond Index
The Bloomberg U.S. Aggregate Bond Index is an index of the U.S. investment-grade fixed-rate bond market, including both government and corporate bonds.
https://www.reuters.com/world/us/goldman-sachs-economists-cut-q3-growth-forecast-us-2021-08-19/
https://www.bea.gov/sites/default/files/2021-10/gdp3q21_adv.pdf
https://www.bea.gov/news/2021/personal-income-and-outlays-september-2021
https://www.census.gov/manufacturing/m3/adv/pdf/durgd.pdf
Compliance Case # 01173289
